12 KiB
| title | description | published | date | tags | editor | dateCreated |
|---|---|---|---|---|---|---|
| FlameGraph | true | 2021-08-23T18:30:49.760Z | 火焰图 | markdown | 2021-08-23T17:06:44.193Z |
Flame Graph
火焰图可以对perf命令记录的软件运行时抽样数据进行可视化,方便快速、准确的分析出执行频率最高的code-path,分析软件运行状态等。经常使用的性能分析火焰图分为以下几类:
- CPU
- Memory
- Off-CPU
- Hot/Cold
- Differential
 上图为对sshd进程使用perf进行采样生成的火焰图
概述
火焰图y轴代表调用栈,x轴则代表该调用栈被抽样到的次数(按照字母序排序),而非时间。火焰图可以理解为将每个抽样到的callstack自底向上排序,再按照字母序从左向右排序。每个矩形代表一个栈帧。矩形宽度越宽代表它出现在栈上的几率越高。顶部的栈帧为当前正在CPU执行的方法的栈帧,下方为其callstack。火焰图颜色没有明确意义,但是有一些约定颜色,下文介绍。Flame graph不同于chrome浏览器中的Flame chart,Flame chart的x轴为时间。
推荐视频(演讲者为flame graph开发者BrendanGregg):
注:火焰图是将包含call stack的抽样数据可视化的工具,profile数据可以使用以下工具在不同平台上生成:
- Linux: perf, eBPF, SystemTap, and ktap
- Mac OS X: DTrace and Instruments
- Windows: Xperf.exe
- Solaris, illumos, FreeBSD: DTrace
实验
使用如下代码模拟火焰图,https://github.com/brendangregg/FlameGraph
#include<stdio.h>

#define COUNT 1000000

void a(){
        for(int i = 0; i < COUNT; i++ );
}

void b(){
        for(int i = 0; i < COUNT; i++ );
        a();
}
void c(){
        for(int i = 0; i < COUNT; i++ );
        b();
}
int main(){
        while(1){
                c();
        }
}
命令如下:
gcc flamegraph.c
./a.out
ps -aux | grep a.out
sudo perf record -F 99 -p pid -g -- sleep 60 #pid替换为实际的pid
sudo perf report -i perf.data
sudo perf script | ./FlameGraph/stackcollapse-perf.pl | ./FlameGraph/flamegraph.pl > out.svg
使用perf report -i perf.data可以分析cpu使用百分比,但是无法看到详细调用栈
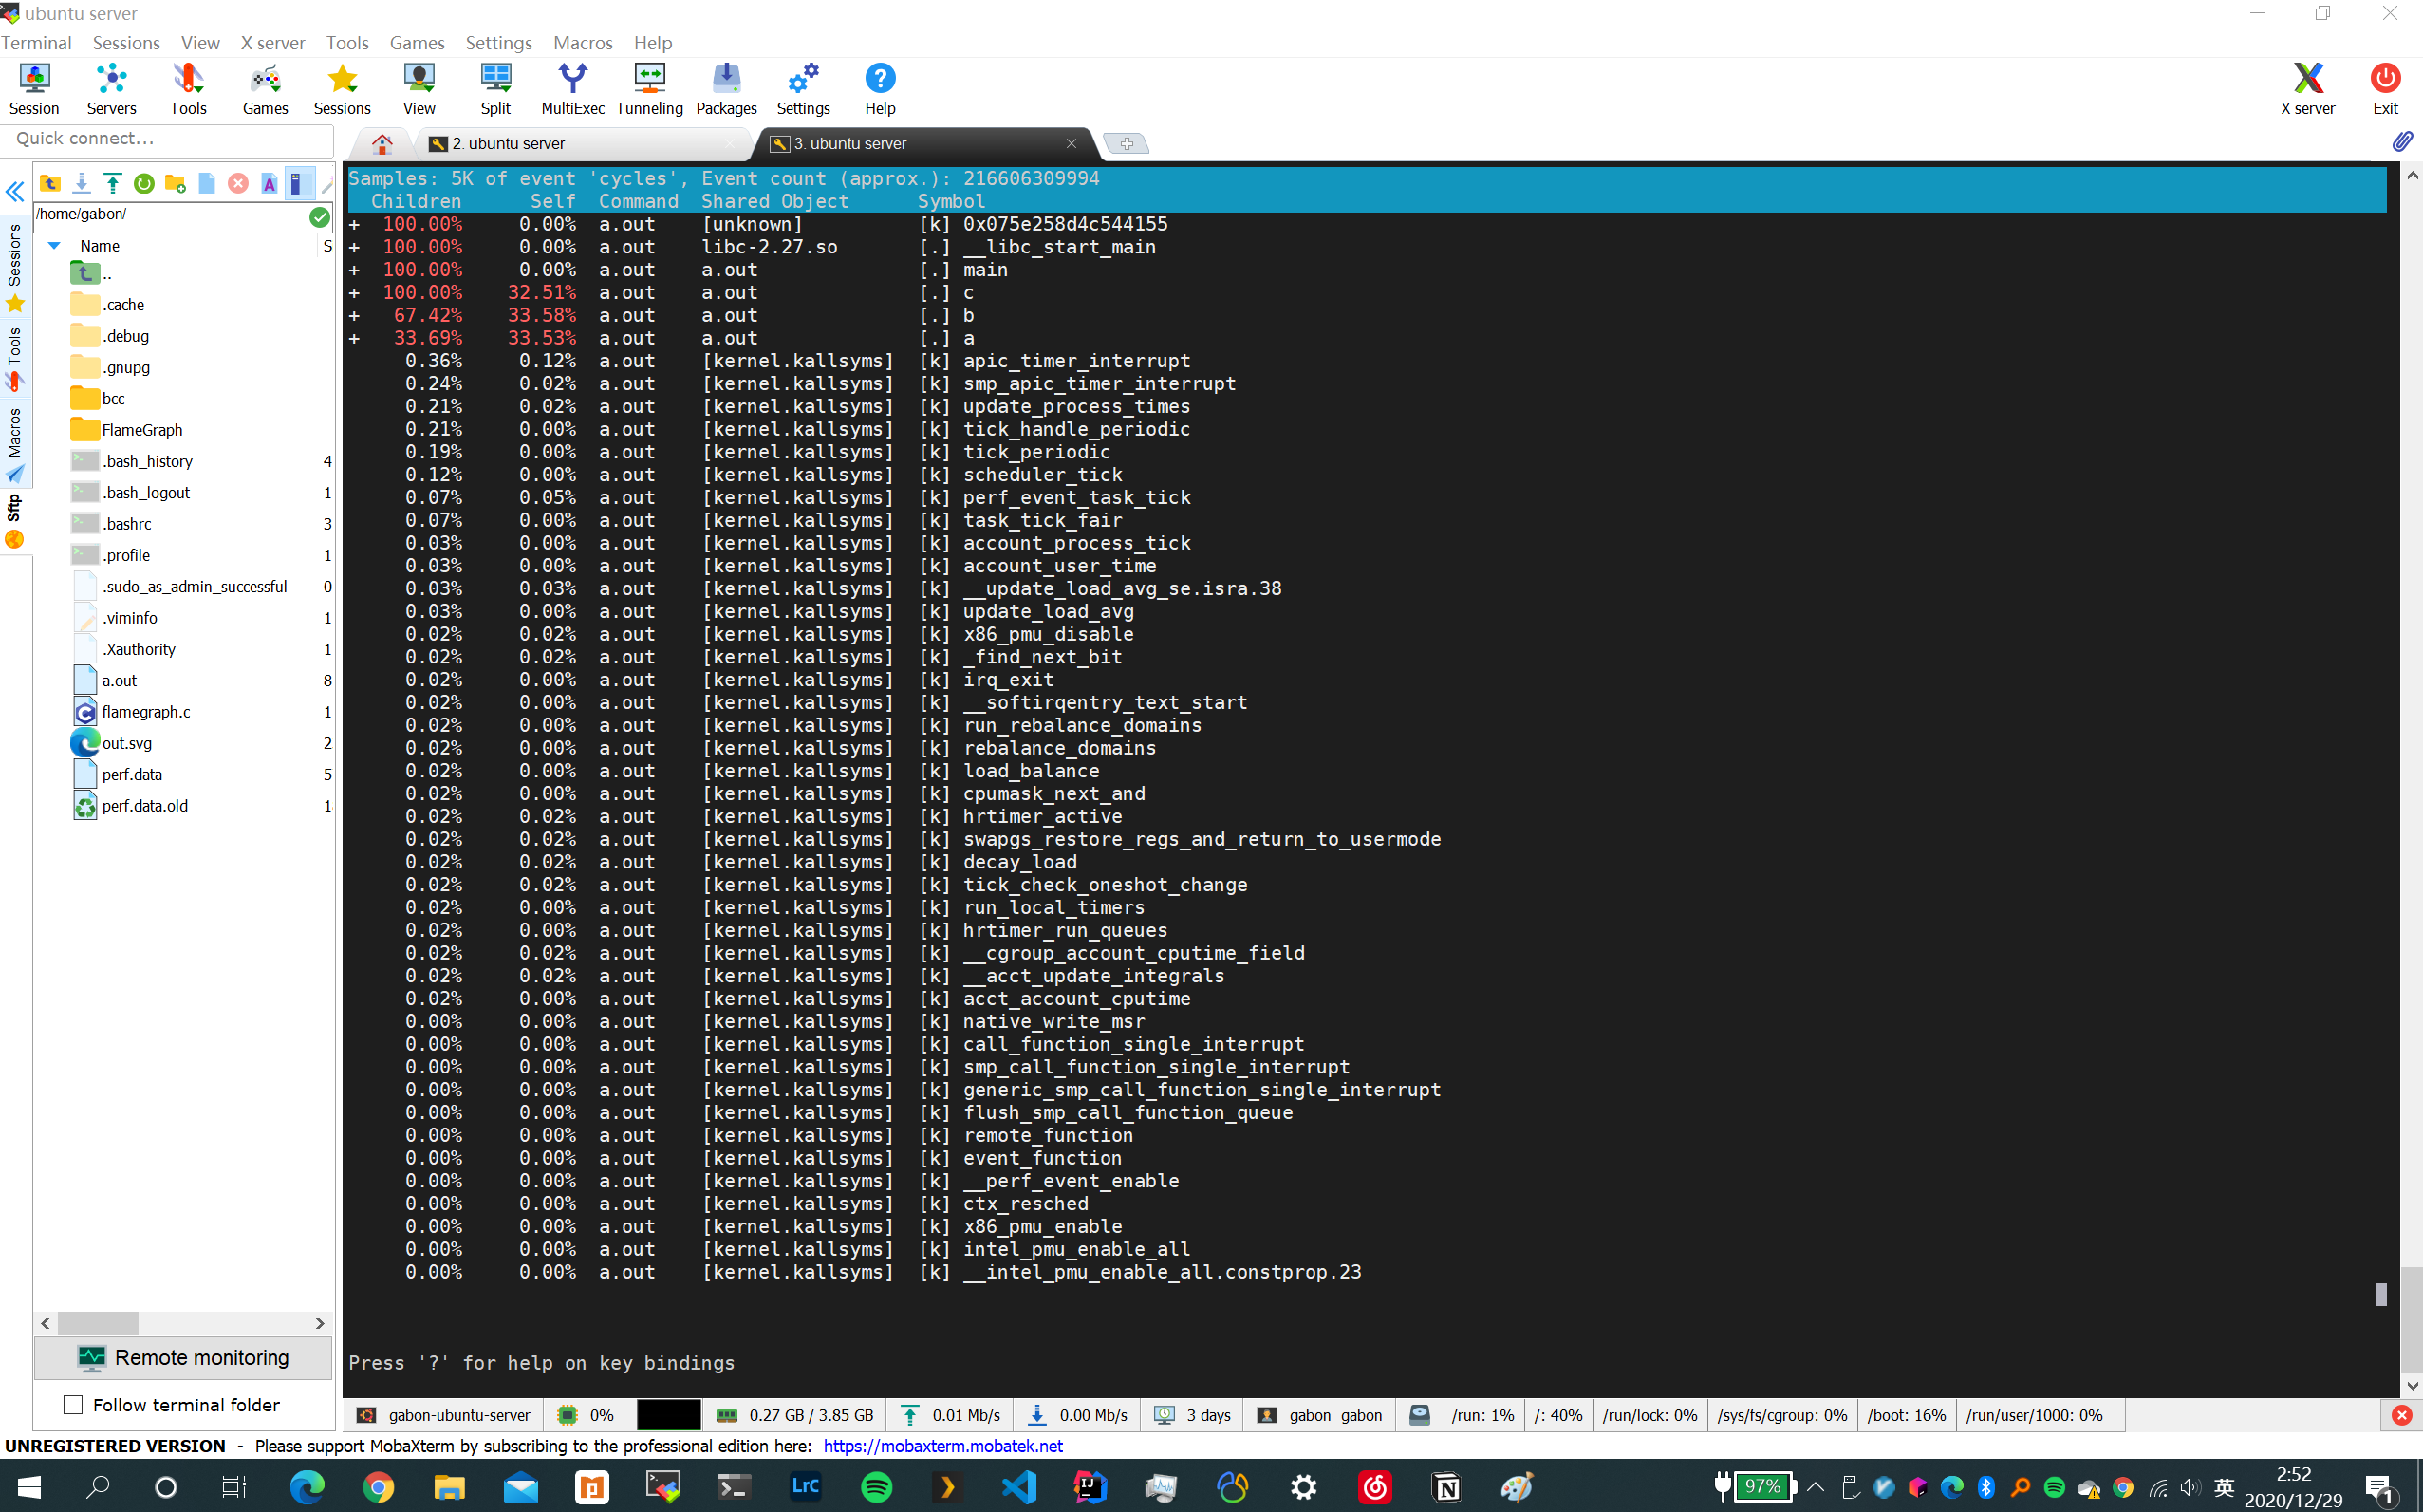
对perf采样数据fold call stack,再生成火焰图
all.main.c
all.main.c
all.main.c
all.main.c.b
all.main.c.b
all.main.c.b
all.main.c.b.a
all.main.c.b.a
all.main.c.b.a
.svg)
Perf
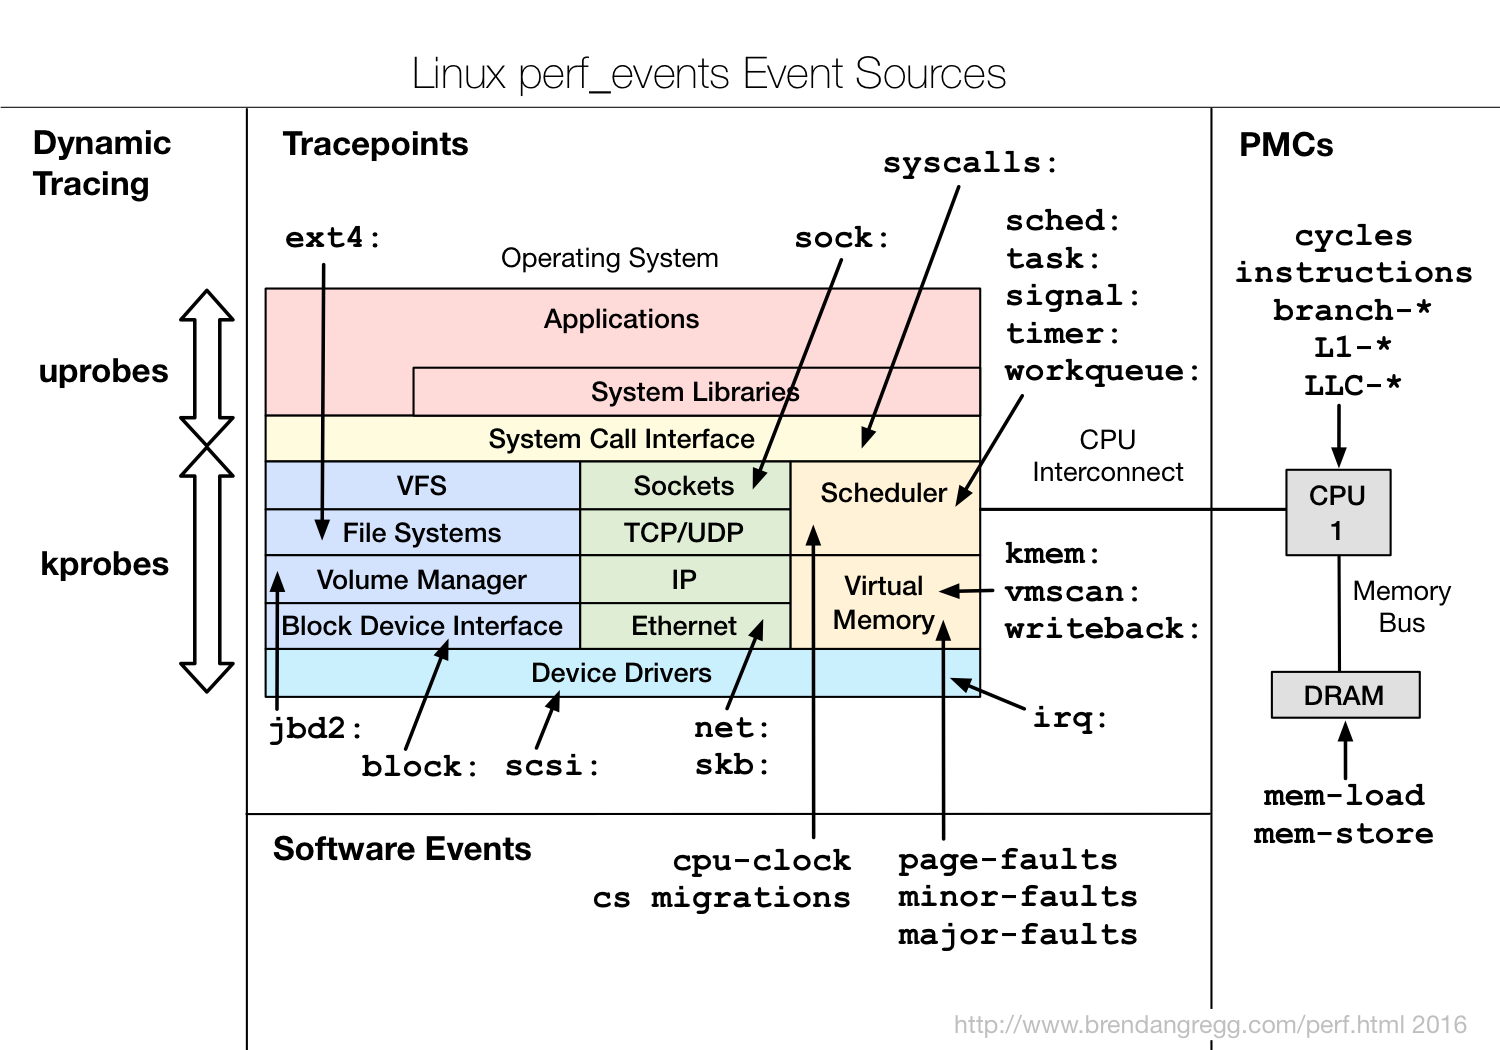
perf是linux系统上的性能分析工具,可以用来分析算法优化(空间复杂度、时间复杂度)、代码优化(提高执行速度、减少内存占用)、 评估程序对硬件资源的使用情况,例如各级cache的访问次数,各级cache的丢失次数、流水线停顿周期、前端总线访问次数等。 评估程序对操作系统资源的使用情况,系统调用次数、上下文切换次数、任务迁移次数(不同cpu之间)。其原理是分析CPU中的硬件Performance Counters记录的数据、内核代码中埋的Tracepoints、内核计数器的低优先级events。
- Performance Counter是CPU中的专用硬件寄存器,可以用来计算cache-misses、branches mispredicted、instructions executed等,这些数据可以用来trace 程序流,确认代码hotspot。
- Tracepoints是Linux内核代码中预置的hook,比如系统调用、TCP/IP事件,文件系统操作等。tracepotints对性能有一定影响,默认关闭,可以通过perf命令开启trace收集时间戳、stack trace信息。perf也可以通过kprobes和uprobes框架动态创建tracepoints分析内核态和用户态的状态。
- Software Events,例如CPU migrations, page faults.
常用命令
- perf stat: obtain event counts
- perf record: record events for later reporting
- perf report: break down events by process, function, etc.
- perf annotate: annotate assembly or source code with event counts
- perf top: see live event count
- perf bench: run different kernel microbenchmarks
应对问题
- Why is the kernel on-CPU so much? What code-paths?
- Which code-paths are causing CPU level 2 cache misses?
- Are the CPUs stalled on memory I/O?
- Which code-paths are allocating memory, and how much?
- What is triggering TCP retransmits?
- Is a certain kernel function being called, and how often?
- What reasons are threads leaving the CPU?
perf_events
- Task-clock-msecs:CPU 利用率,该值高,说明程序的多数时间花费在 CPU 计算上而非 IO。
- Context-switches:进程切换次数,记录了程序运行过程中发生了多少次进程切换,频繁的进程切换是应该避免的。
- Cache-misses:程序运行过程中总体的 cache 利用情况,如果该值过高,说明程序的 cache 利用不好
- CPU-migrations:表示进程 t1 运行过程中发生了多少次 CPU 迁移,即被调度器从一个 CPU 转移到另外一个 CPU 上运行。
- Cycles:处理器时钟,一条机器指令可能需要多个 cycles,
- Instructions: 机器指令数目。
- IPC:是 Instructions/Cycles 的比值,该值越大越好,说明程序充分利用了处理器的特性。
- Cache-references: cache 命中的次数
- Cache-misses: cache 失效的次数。
背景知识
Symbols
符号表
JIT Symbols (Java, Node.js)
Stack Traces
性能调优工具如 perf,Oprofile 等的基本原理都是对被监测对象进行采样,最简单的情形是根据 tick 中断进行采样,即在 tick 中断内触发采样点,在采样点里判断程序当时的上下文。假如一个程序 90% 的时间都花费在函数 foo() 上,那么 90% 的采样点都应该落在函数 foo() 的上下文中。运气不可捉摸,但我想只要采样频率足够高,采样时间足够长,那么以上推论就比较可靠。因此,通过 tick 触发采样,我们便可以了解程序中哪些地方最耗时间,从而重点分析。
perf_events is an event-oriented observability tool, which can help you solve advanced performance and troubleshooting functions. Questions that can be answered include:
算法优化(空间复杂度、时间复杂度)、代码优化(提到执行速度、减少内存占用) 评估程序对硬件资源的使用情况,例如各级cache的访问次数,各级cache的丢失次数、流水线停顿周期、前端总线访问次数等。 评估程序对操作系统资源的使用情况,系统调用次数、上下文切换次数、任务迁移次数程序代码调优工具perf学习记录 - carterzhang - 博客园 (cnblogs.com)
perf_events is part of the Linux kernel, under tools/perf. While it uses many Linux tracing features, some are not yet exposed via the perf command, and need to be used via the ftrace interface instead. My perf-tools collection (github) uses both perf_events and ftrace as needed.
Background
符号表
perf 跟踪依赖与调试信息(symbols), 调试符号表的作用就是将内存的十六进制翻译为对应的函数即参数.
对于内核, 通过安装对应内核版本的调试包, 可以解决. 还可以自己手动编译内核源码增加调试相关信息. 对于用户态, 通过安装对应程序的调试符号包也可以解决. 还可以自己手动编译源码,不要 strip 调试符号.
检验你所用的内核是否支持调试符号, 运行
cat /boot/config-2.6.32-642.4.2.el6.x86_64 | grep CONFIG_KALLSYMS
CONFIG_KALLSYMS=y
CONFIG_KALLSYMS_ALL=y
CONFIG_KALLSYMS_EXTRA_PASS=y
栈帧
被优化的程序是忽略栈指针的, 如果没有栈帧, 有些调试符号就不能正确地显示.
自从 kernel 3.9, 对于应用户态的程序, perf_events 支持利用 dwarf(libunwind) 来绕过这个缺失栈帧的问题. 在编译的时候加上 -g dwarf 即可.
对应用户态, 编译时增加:
-fno-omit-frame-pointer:
对应内核,编译时加参数
CONFIG_FRAME_POINTER=y
帧指针重用
gcc flamegraph.c -o omitframepointer.out -fomit-frame-pointer

开启帧指针重用后,无法正确显示调用栈,stack walking有问题
java
实现 Java 火焰图的两个问题:
- The JVM compiles methods on the fly (just-in-time: JIT), and doesn't expose a traditional symbol table for system profilers to read.
- The JVM also uses the frame pointer register (RBP on x86-64) as a general purpose register, breaking traditional stack walking.
解决上面两个问题的办法
- A JVMTI agent, perf-map-agent, which can provide a Java symbol table for perf to read (/tmp/perf-PID.map).
- Patching JDK hotspot to reintroduce the frame pointer register, which allows full stack walking.
flame graph
如何生成火焰图
火焰图深度、宽度含义
cpu、mem、Off-CPU Flame Graphs、Hot/Cold Flame Graphs火焰图
生产中解决的问题


参考文章:
- http://www.brendangregg.com/perf.html
- http://www.brendangregg.com/FlameGraphs/cpuflamegraphs.html
- http://www.brendangregg.com/FlameGraphs/memoryflamegraphs.html
- http://www.brendangregg.com/FlameGraphs/offcpuflamegraphs.html
- http://www.brendangregg.com/FlameGraphs/hotcoldflamegraphs.html
- http://www.brendangregg.com/blog/2014-11-09/differential-flame-graphs.html
- http://www.brendangregg.com/ebpf.html
- http://www.brendangregg.com/flamegraphs.html
- https://netflixtechblog.com/java-in-flames-e763b3d32166
- https://medium.com/@maheshsenni/java-performance-profiling-using-flame-graphs-e29238130375
- https://medium.com/@maheshsenni/java-performance-profiling-using-flame-graphs-e29238130375
- http://engineering.conversantmedia.com/technology/2016/12/01/java-memory-allocation-flamegraph/
- https://tech.meituan.com/2020/10/22/java-jit-practice-in-meituan.html
- http://www.trueeyu.com/2014/10/31/fno-omit-frame-pointer/
- https://www.cnblogs.com/carterzhang/p/6184342.html
- 1Lzot5BYTI7pmbKdPd9w-5mLScFhQBKGV?usp=sharing